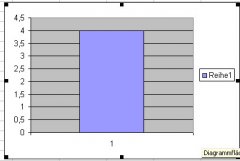
Sub test()
ausgabe = 5


    Dim oXL As Object        ' Excel application
    Dim oBook As Object      ' Excel workbook
    Dim oSheet As Object     ' Excel Worksheet
    Dim oChart As Object     ' Excel Chart

    Dim iRow As Integer      ' Index variable for the current Row
    Dim iCol As Integer      ' Index variable for the current Row

    Const cNumCols = 2     ' Number of points in each Series
    Const cNumRows = 1       ' Number of Series


    ReDim aTemp(1 To cNumRows, 1 To cNumCols)

    'Start Excel and create a new workbook
    Set oXL = CreateObject("Excel.application")
    Set oBook = oXL.Workbooks.Add
    Set oSheet = oBook.Worksheets.Item(1)

    ' Insert Random data into Cells for the two Series:
    Randomize Now()
    For iRow = 1 To cNumRows
          aTemp(iRow, 1) = "Wert:" 'Diese datenbeschriftung erscheint dann in der legende, so wird einfach der text eingegen!
          aTemp(iRow, 2) = ausgabe
    Next iRow
    oSheet.Range("A1").Resize(cNumRows, cNumCols).Value = aTemp

    'Add a chart object to the first worksheet

    Set oChart = oSheet.ChartObjects.Add(50, 40, 300, 200).Chart
    With oChart
        .SetSourceData Source:=oSheet.Range("A1").Resize(cNumRows, cNumCols)
        .Axes(xlCategory, xlPrimary).HasTitle = True
        .Axes(xlCategory, xlPrimary).AxisTitle.Characters.Text = "x-achsenbeschr"
        .HasTitle = True
        .ChartTitle.Characters.Text = "Diagrammtitel"
        .HasAxis(2, 1) = False '(oder auch: "oChart.HasAxis(xlValue, xlPrimary) = False") keine beschr. der y-achse
   End With
   Set oChart = Nothing
    ' Make Excel Visible:
    oXL.Visible = True

    oXL.UserControl = True

     'tipp: am saubersten: mit "nothing" ojekte wieder freigeben
    Set oSheet = Nothing
    Set oBook = Nothing
    Set oXL = Nothing


End Sub

